Automating latency and uptime checks with Globalping on Linux and macOS

Whenever you need to test or troubleshoot your network, the ping command comes to the rescue, providing insights into the latency and availability of a target host.
But imagine you want to use ping to monitor your website's uptime – repeatedly running ping manually is too impractical, and investing in a full-scale monitoring tool is overkill for such a small task. Another challenge arises when you want to test from different locations, as ping is usually limited to where it's executed, like your laptop or a remote server.
So, in this guide, we'll explore a solution to this problem and show you how to run ping commands from any location using our network testing platform Globalping. Moreover, we'll explore how to automate the command to run on Linux and macOS, building the foundation for simple uptime monitoring and latency measurement over time.
Getting started with Globalping
Globalping is an open-source network testing platform with a vast network of global probes hosted by community members. Thanks to this network, you can use the Globalping API, CLI tool, or Slack app to define almost any location from which you want to run a network measurement command, such as ping or traceroute. The platform then picks probes from the specified places, lets them execute the command, retrieves the results, and delivers them back to you.
So let's get you started with the Globalping CLI tool and see the platform's functionality in action!
First, you need to install the Globalping CLI tool on your system. Open your terminal and execute the appropriate command for your operating system:
Ubuntu/Debian (deb):
```
curl -s https://packagecloud.io/install/repositories/jsdelivr/globalping/script.deb.sh | sudo bash
apt install globalping
```
macOS (Homebrew):
```
brew tap jsdelivr/globalping
brew install globalping
```
Note: If you're having trouble, refer to the README on GitHub for the most up-to-date instructions on installing and running the Globalping CLI tool.
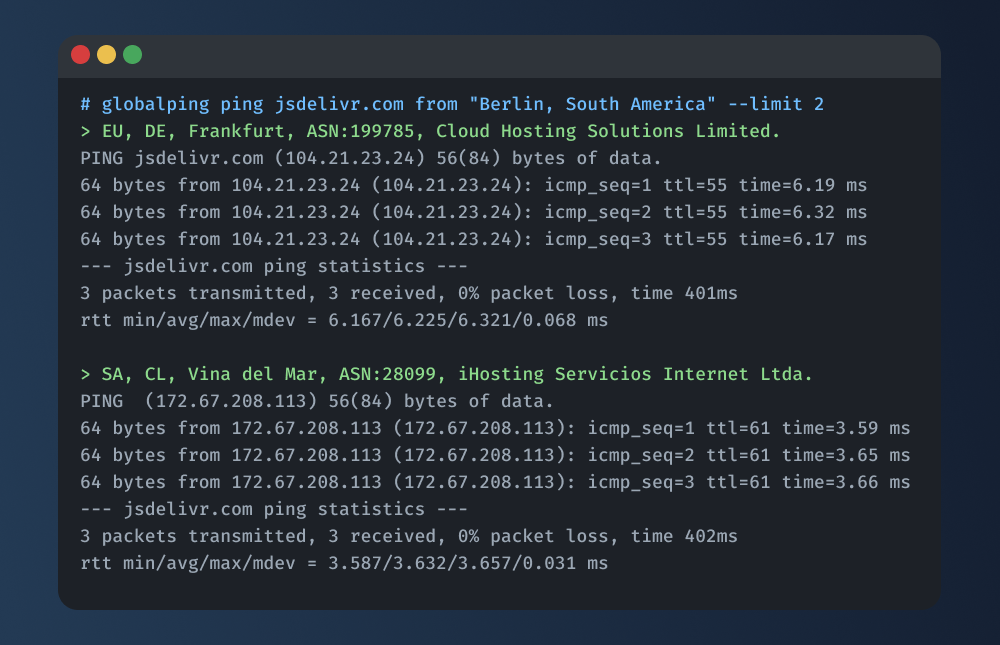
Once you have set up the CLI tool, it's time to run your first ping command with Globalping. How about pinging the jsdelivr.com website from two probes, one in Germany and one in South America? Give it a try with the following command:
globalping ping jsdelivr.com --from "Germany, South America" --limit 2
The result should look something like this (please note that the results may vary depending on the probes the API utilizes!):
Note: We won't go into reading ping results in this guide, so check out blog posts like this one written by Nicholas to learn more.
Let's take another look at the command:
The --from option allows us to specify the location from which to execute the command. Valid locations are countries, continents, cities, US states, regions (Western Europe), ASNs, ISP names, and cloud region names (us-east-2). The Globalping API smartly interprets the provided location, so feel free to experiment with different inputs!
We used the --limit option to specify the number of probes to use (by default, the limit is set to 1). And since we set the limit to 2 and defined two locations, the API selected one probe from each place to execute the command.
Note: All Globalping CLI commands support a variety of options. To learn more about the Globalping ping command, see some usage examples, and view all available options, run ping with the --help option:
globalping ping --help
Creating a script to automate ping tests
Now that we know how to run a single ping test using the Globalping CLI, it's time to explore automation.
Step 1:
First, let's decide on the ping command we want to automate. For this example, we'll go with the following one:
globalping ping jsdelivr.com --from Berlin --ci --json
We use the --ci option, which eliminates any coloring from the output and ensures that the command waits for all data to arrive before returning it. This waiting step is essential to process the data within our script!
Additionally, we use the --json flag to retrieve the ping results in JSON from the Globalping API. By doing so, we gain access to additional data not part of a traditional ping output, such as details about the used probes. Moreover, having the data as JSON makes it easy for us to parse and process the data in a script.
Step 2:
Next, we'll create a script that runs the ping command automatically. Depending on your programming skills and operating system, you have several options, such as writing the script in Python, Bash, or PowerShell (if you're on Windows).
Let's start by creating a simple Bash script that executes the command and presents the results:
```
#!/bin/bash

# Define the ping command
ping_function(){
    globalping ping jsdelivr.com --from Berlin --ci --json
}

# Execute the ping command and capture the output
ping_result=$(ping_function)

# Display the result
echo "$ping_result"
```
Save the file somewhere on your system with the name "globalping-ping.sh" and make it executable with the following command:
chmod +x globalping-ping.sh
Let's test the script! You can execute the script directly from the folder where it's stored:
./globalping-ping.sh
Running the script should return the ping results as JSON. Check out our API reference to learn more about the response data.
Enhancing our script
Let's elevate the usefulness of our script!
Before we start, ensure you have installed the CLI tool JQ, allowing us to extract and process the JSON data we get from the Globalping API in our terminal and script. We also recommend that you familiarize yourself with the basic functionality of JQ before moving forward.
Ready? Let's explore two typical monitoring scenarios:
1) Latency checks
Monitoring round trip times (RTT) in ping results helps detect network congestion, high server loads, or delays in DNS resolution, all of which may lead to heightened latency.
In this scenario, we want to identify abnormally high RTT in ping results by comparing them against a custom threshold value. If the maximum RTT surpasses this threshold, we'll extract relevant data from the Globalping API response for further processing.
First, let's use JQ to extract the maximum RTT (in milliseconds) from the ping result JSON:
max_value=$(echo $ping_result | jq '.results[].result.stats.max')
Next, we compare the extracted max_value with a threshold RTT value you can customize according to your needs. For testing, start with a low value (e.g., 2 ms) and adjust it for production use.
If the check passes, we create a new JSON object containing data from the API response, including details about the probe, ping statistics, and the raw ping result text. Finally, we display this JSON in the terminal but feel free to modify the script to store it in a file or send it via email.
```
# Check if the max RTT is > 2 ms (adapt this number to your use case)
if (( $(echo "$max_value > 2" |bc -l) )); then
 # Use JQ to extract data from the API's JSON response; For example:
 # Get the ping's stats, including min, max, and average RTT
 stats=$(echo $ping_result | jq '.results[].result.stats')
 # Get details about the used probe
 probe=$(echo $ping_result | jq '.results[].probe')
 # Let's also include the ping's raw output
 raw_output=$(echo $ping_result | jq '.results[].result.rawOutput')

# Create a new JSON object with the extracted data
 new_json=$(jq -n --argjson probe "$probe" --argjson stats "$stats" --argjson rawOutput "$raw_output" '{probe: $probe, stats: $stats, rawOutput: $rawOutput}')

# Take action: send the data via email or store it in a file
 # For testing, let's output it to the terminal:
 echo "$new_json"
fi
```
Let's briefly examine the line in which we construct the new JSON object with JQ:
new_json=$(jq -n --argjson probe "$probe" --argjson stats "$stats" --argjson rawOutput "$raw_output" '{probe: $probe, stats: $stats, rawOutput: $rawOutput}')
In this line, we use the jq command with the -n flag to generate new JSON and the --argjson flag to pass the JSON data extracted from the API response as arguments ($probe, $stats, and $raw_output). Then, we use these arguments to create the desired JSON structure.
2) Simple uptime checks
In this second scenario, we want to detect failed pings and extract the raw ping output, which contains details about the error, for further processing. The most common reasons why a ping fails include an unavailable host, unresolved hostname, or network glitches.
Let's start by extracting the ping result status from the API response. In case a ping fails, the status value within the result object will be set to failed.
Note: Still running tests have a status of in-progress, and successfully completed tests are finished.
ping_status=$(echo $ping_result | jq -r '.results[].result.status')
Note: Using the -r option outputs strings directly to standard output without JSON formatting, i.e., without the quotes.
Next, we check if the status is set to "failed". If so, we extract the raw ping output from the JSON object and display it in the terminal. Again, you can modify this to your needs, for example, by sending an alert via email.
```
# Check if status is failed
if [ "$ping_status" == "failed" ]; then
 # Get the ping's raw output
 raw_output=$(echo $ping_result | jq '.results[].result.rawOutput')

# Take action: send the data via email or store it in a file
 # For testing the script, let's output it to the terminal:
 echo "$raw_output"
fi
```
If you can’t manipulate the availability of your target host to test the script, you can provide an invalid target address, which also makes the ping fail.
Note: You can find the entire example script here.
Congratulations on reaching this point! We're now ready for the final segment of this guide: automating the execution of our script. Let's go!
Running our ping script automatically
Let's learn how you can schedule and run the script automatically. Before we start, take a moment to decide on the execution period. For example, you can run the script every hour, every five minutes, or at any frequency that best suits your needs. For this guide, we'll schedule it to run once an hour.
Scheduling on Linux using crontab:
Cron is a job scheduler that automatically executes tasks according to a set schedule, and crontab (cron table) lists the commands or tasks to be completed.
So to have our script run automatically, we need to add it to crontab:
Step 1:
Open your terminal and use the following command to edit crontab:
crontab -e
When prompted, choose an editor of your choice.
Step 2:
You can now see the contents of the crontab file, which may already contain entries. Add a new line at the end to schedule our ping script (don't forget to update the path):
0 * * * * /path/to/globalping-ping.sh
This example schedules the script to run every hour. You can modify the schedule to match your desired period based on the logic explained in more detail here.
Step 3:
Save the file and close the editor. Cron will now automatically run your script at the specified intervals.
Note: If you encounter problems, ensure that the ping script is executable (check the permissions) and that you have specified the correct paths for Linux or macOS.
And that's it! With this automated setup, your Globalping ping script will run according to the set schedule.
Conclusion
Congratulations, you have just created a straightforward script to automate ping tests using Globalping, empowering you to monitor latency and uptime!
If you're eager to further explore scripting, you can customize your Bash script to add more functionality. Also, feel to try other network measurements using the Globalping CLI tool, such as traceroute, dns, or HTTP HEAD requests.
We'd love to hear from you! Visit us on GitHub to share your thoughts and ideas or even contribute to the Globalping community.